Introduction of Norms in Psychological Testing
The norms are thus empirically established by determining what a representative group of persons actually do on the test. Any individual’s raw score is then referred to the distribution of scores obtained by the standardization sample, to discover where he falls in that distribution.
|

Norms : Comparison to Normative group
Purpose of Norms
Psychological tests are designed to measure specific constructs, such as abilities, aptitudes, personality traits, or attitudes. These tests generally fall into two categories: quantitative and qualitative. Quantitative tests involve a fixed set of items that are scored objectively using a predetermined scale. However, without additional interpretive data, the raw scores obtained on these tests are meaningless.
For Example:
- knowing that a person solved 15 problems on an arithmetic test or assembled a mechanical object in 57 seconds doesn’t reveal much about their abilities or how they compare to others.
- Suppose an individual scores 45 on a math test and 65 on a vocabulary test. Without a frame of reference, we can’t determine if they excel in one area over another, as raw scores on different tests are usually expressed in different units where a direct comparison of such scores is impossible.
- If two individuals take different tests assessing the same skill, comparing their abilities based solely on raw scores is unreliable. Since the difficulty level of the particular test would also affect such a comparison between raw scores.
This is where norms come in—they provide a frame of reference, allowing us to understand an individual’s standing relative to others, ensuring fairer and more accurate interpretations of test results.

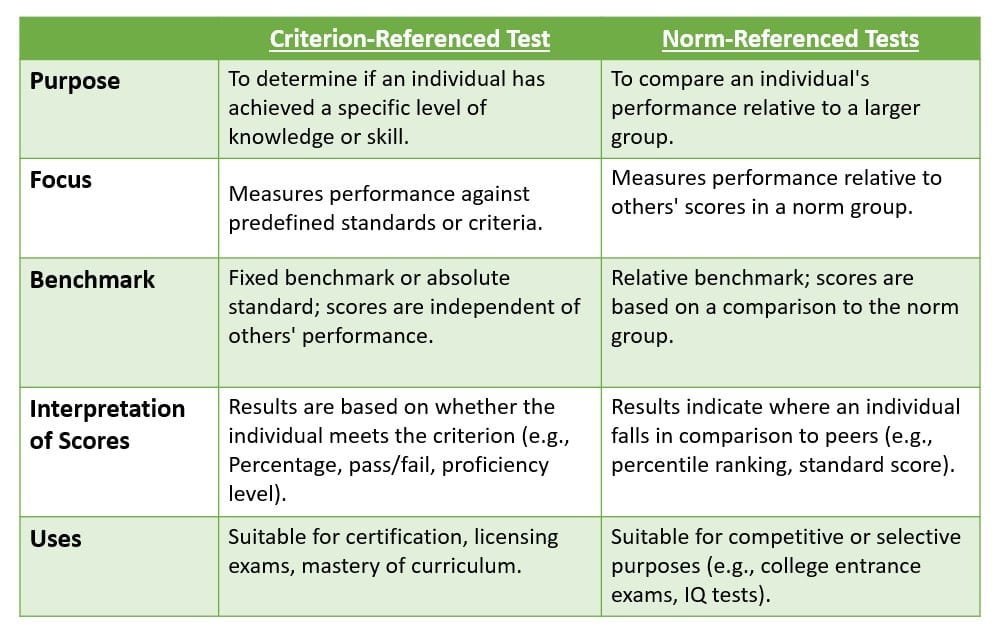
Frame of Reference : Criterion-referenced & Norm-referenced tests
Now let’s see the core concept in the Norm-referenced tests : The NORMS
Definition of Norms
A standard or range of values that represents the typical performance of a group or of an individual (of a certain age, for example) against which comparisons can be made (APA, 2018).
In a psychometric context, norms are the test performance data of a particular group of test takers that are
designed for use as a reference when evaluating or interpreting individual test scores. (Cohen & Swerdlik, 2013).
The norms are empirically established by determining what a representative group of persons actually do on the test. Any individual’s raw score is then referred to the distribution of scores obtained by the standardization sample, to discover where he falls in that distribution (Anastasi, 1976).
To illustrate, imagine you took an intelligence test. The raw score alone doesn’t provide enough insight into your cognitive abilities. But by comparing your score to norms derived from a sample of similar individuals, such as age or demographic peers, we gain a clearer picture of your relative performance. Norms convert your raw score into an understanding of how your performance compares within a defined population, making it a powerful interpretive tool in assessments.
Process of Norm Development

Process of Norm Development
- Define the Purpose and Population of the Test : Identify the purpose of the test and the population for whom the norms are being developed (e.g., age, education level, cultural background).
- Select a Representative Sample : Use sampling methods to select a group that accurately represents the target population in terms of key demographics (e.g., age, gender, socioeconomic status, etc.).
- Administer the Test to the Sample Group : Conduct standardized test administration on the representative sample to ensure consistency in testing conditions and accurate data collection.
- Collect and Analyze the Data : Collect raw scores from the sample and conduct statistical analyses to ensure the data’s reliability, validity, and accuracy for norm development.
- Calculate Descriptive Statistics : Calculate central tendency measures (mean, median) and variability (standard deviation) to establish the typical range of scores for the population.
- Convert Raw Scores to Normative Scores : Use raw score data to generate standard scores, percentiles, or other normative measures that make scores interpretable.
- Establish Norm Tables : Create norm tables based on the normative scores, organizing data to facilitate quick and accurate score interpretation for future test-takers.
- Periodic Revision and Updating of Norms : Update norms as necessary over time to maintain their relevance to the population, particularly if demographic changes occur.
Statistical Concepts related to Norms
A major object of statistical method is to organize and summarize quantitative data in order to facilitate their understanding. After collecting data from a large normative sample, a first step in bringing order into such a chaos of raw data is to tabulate the scores into a frequency distribution. The information provided by a frequency distribution can also be presented graphically in the form of a distribution curve like histograms and frequency polygon.

Normal Distribution Curve : Most distributions of human traits, from height and weight to aptitudes and personality characteristics, approximate the normal curve.
The normal distribution is a probability distribution that is symmetric about the mean, representing a natural distribution of data in many psychological contexts. It is often depicted as a bell-shaped curve. In a perfectly normal distribution, three measures of central tendency i.e mean, median and mode are all equal.
Standard deviation (denoted by σ) is a measure of the amount of variation or dispersion in a set of scores. It quantifies how spread out the scores are from the mean.
- A low SD indicates that the scores are close to the mean, suggesting consistency in test performance.
- A high SD signifies a wide range of scores (wider spread of the curve), indicating variability in test performance.
Types of Norms
There are two types of norms : (1) Developmental Norms (2) Percentile Ranks (3) Standard Scores

Types of Norms
1. Developmental Norms
When a trait being measured develops systematically with time, it is feasible to create the developmental norms (Hogan, 2013 ). They indicate how far along the normal developmental path the individual has progressed. Developmental norms have naturalness in their meaning and hence easy to understand. There are two types of developmental norms:
A. Age Equivalent Norms
- Age equivalent norms are primarily used with some mental ability tests, hence the score is called as “mental age” (MA). MA is primary example of age equivalents and originated with the Binet intelligence scale.
- MA is determined by finding the typical score for test takers at successive age levels. For examples, those items
passed by the majority of 7-vear-olds in the standardization sample are placed in the 7-year level, those passed by the majority of 8-year-olds are assigned to the 8-vear level, and so forth. - The age groups may be formed by year, half-year, 3 month intervals, etc.
- Age-equivalent norms are especially useful in understanding developmental progressions, as they provide insight into whether an individual is meeting, exceeding, or lagging behind the expected skills for their chronological age.
- Limitation : It should be noted that the mental age unit does not remain constant with age, but tends to shrink with advancing years.
- For example: the difference in cognitive functioning between a five-year-old and a seven-year-old is quite marked. However, as people grow older, the rate of cognitive development slows down, and the changes from one year to the next become less pronounced. The difference between the mental capabilities of a 25-year-old and a 27-year-old, for instance, is relatively small compared to the differences seen in early childhood.
Hence, mental age scores are most meaningful in early developmental years and become less useful as indicators of cognitive progress or ability in adulthood.
B. Grade Equivalent Norms
- A grade-equivalent score represents the grade level and month within that grade at which the average student would achieve a similar score. For example, if a third-grade student receives a grade-equivalent score of 5.4 on a reading test, it means their reading level is comparable to that of an average student in the fourth month of fifth grade.
- Grade norms are found by computing the mean raw score obtained by children in each grade. Thus, if the average number of problems solved correctly on an arithmetic test by the fourth graders in the standardization sample is 23, then a raw score of 23 corresponds to a grade equivalent of 4.
- Limitation :
- The content of instruction varies somewhat from grade to grade. Grade units are unequal and these inequalities occur irregularly in different subjects. Hence, grade norms are appropriate only for common subjects taught throughout the grade levels covered by the test.
- Grade norms are also subject to misinterpretation. For example, if a fourth-grade child obtains a grade equivalent of 6.9 in arithmetic, it does not mean that he has mastered the arithmetic processes taught in the sixth grade. He undoubtedly obtained his score largely by superior performance in fourth-grade arithmetic. It certainly could not be assumed that he has the prerequisites for seventh-grade arithmetic.
2. Percentile Rank
Definition of Percentile
According to Hogan (2013), Percentile is a point on the scale below which a specified percentage of of cases falls. For example, if 28 percent of the persons obtain fewer than 15 problems correct on an arithmetic reasoning test, then a raw score of
15 corresponds to the 28th percentile.
- A percentile indicates the individual’s relative position in the standardization sample. Percentiles can also be regarded as ranks in a group of 100, except that in ranking it is customary to start counting at the top, the best person in the group receiving a rank of one (Anastasi, 1976).
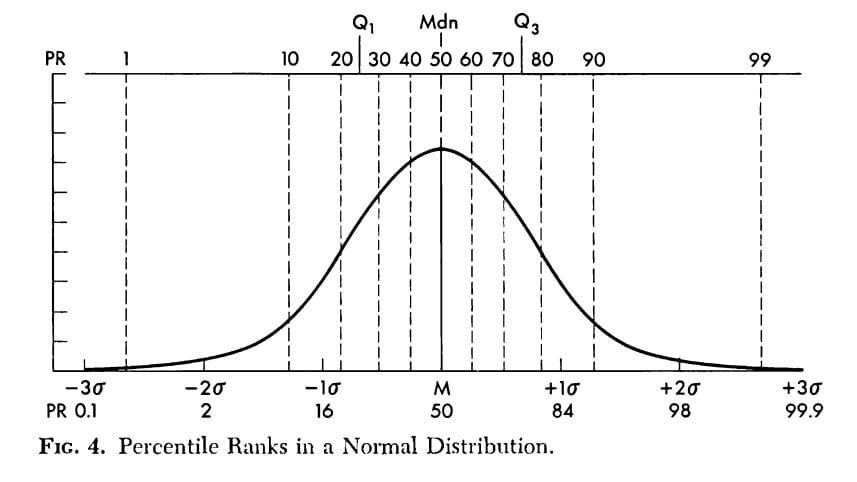
- The 50th percentile (P50) corresponds to the median, a measure of central tendency. The 25th and 75th percentile are known as the first and third quartile points (Q1 and Q3)
Strengths of Percentile rank
- They can be easily computed and understood without any serious statistics training.
- They are almost universally applicable to all kinds of scores, for variety of populations and purposes.
Limitations of Percentile Rank
- Percentiles are marked on the ordinal scale, hence shows irregularity in the intervals.
- If the distribution of raw scores approximates the normal curve, as is true of most test scores, then raw score differences near the median or centre of the distribution are exaggerated in the percentile transformation, whereas raw score differences near the ends of the distribution are greatly shrunk.

Percentile in NDC
For example: Given the raw score difference, say 3 points, will cover many percentile points in the middle of distribution, but only a few percentile points in either tail of the distribution.
3. Standard Scores (Z scores)
Definition of Standard Scores
Standard scores express the individual’s distance from the mean in terms of the standard deviation of the distribution (Anastasi, 1976).
Standard scores may be obtained by either linear or nonlinear transformations of the original raw scores. When found by a linear transformation, they retain the exact numerical relations of the original raw scores and often designated as “z scores.”

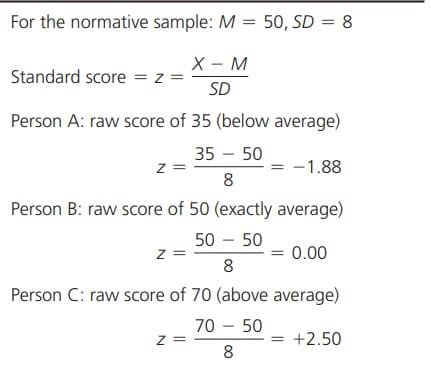
Computation of Standard Scores on
a Hypothetical Test
- Z score value can be positive, negative or zero.
- Positive z score = Above average performance
- Negative z score = Below average performance
- Zero = Average performance : score is exactly at the mean
- Z score shows how many standard deviations, the raw has deviated from the mean.
- Z-scores are particularly useful when data is normally distributed, as they can be used to calculate probabilities and percentiles, which are common in psychometric assessments and research.
- Z-scores allow comparisons of scores from different distributions.
Types of Standard Scores
A. T- Scores
T scores, sometimes called McCall’s T scores, are standard scores with mean of 50 and standard deviation of 10. (Hogan, 2013 )
T scores can be derived from z scores : T = 50 + ( 10 × z )
Benefit of T-score : Because T-scores are set on a scale with a mean of 50 and a standard deviation of 10, they avoid the use of negative values, which are common in z-scores for below-average performance. This makes T-scores more user-friendly, especially in educational and psychological reports.
T-scores are widely used in assessments such as personality inventories, IQ tests, and other standardized psychological tests to provide interpretable scores relative to a normative sample. For example, on the MMPI (Minnesota Multiphasic Personality Inventory).
B. Deviation IQ
- Deviational IQ (DIQ) is a modern approach to calculating IQ scores based on standard deviations from the average IQ within a specific age group, rather than the older “mental age” formula [(MA/CA) × 100].
- Deviational IQ uses a standardized scale to measure cognitive ability relative to the population mean, which is set at 100, with a standard deviation of 15 or sometimes 16, depending on the test.
- This approach allows for more accurate comparisons across age groups, especially in adulthood, where the traditional concept of mental age becomes less meaningful.
- This structure means that most scores will fall within predictable ranges:
- Approximately 68% of people will score between 85 and 115 (within one standard deviation of the mean).
- 95% will score between 70 and 130 (within two standard deviations).
| Test | Mean | SD |
| Wechsler Intelligence test (WAIS, WISC, WPPSI) | 100 | 15 |
| Stanford Binet and Otis-Lennon Test | 100 | 16 |
| Scholastic Assessment Test (SAT), Graduate Record Exam (GRE) | 500 | 100 |
| Personality Test Scales (MMPI-2 Depression, Paranoia) | 50 | 10 |
C. Stanines
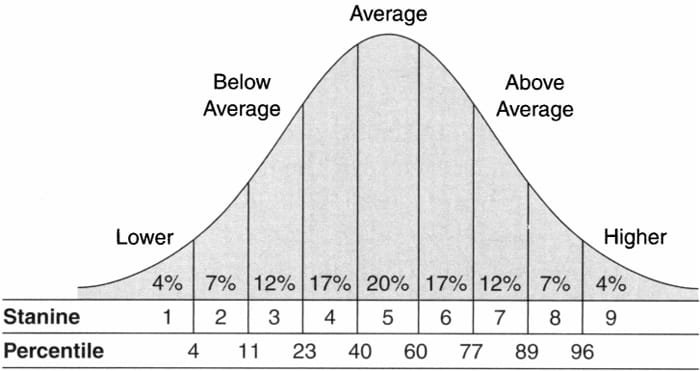
Stanines, a contraction of “Standard nine” are a standard score system with Mean = 5 and standard Deviation = ~2. Stanines were constructed to divide normal distribution into 9 equal units .

The Stanine distribution
Stanines are always derived by reference to the percentile division as shown in the figure.
They are used extensively for reporting scores on standardized achievement tests and some mental ability tests in elementary & secondary schools.
Conclusion
In conclusion, norms are essential in psychological testing, providing a standardized frame of reference that transforms raw scores into meaningful insights about individual performance. By establishing averages and distributions within a specific population, norms enable us to interpret where an individual stands relative to peers, whether through age-based norms, grade-equivalent measures, or broader statistical methods like standard deviations and percentile ranks.
Frameworks like criterion-referenced and norm-referenced tests further refine how we view results, allowing for either objective standards or comparisons within a normative group. Tools such as frequency distributions, standard deviation, and derived scores like stanines, z-scores, and T-scores offer nuanced ways to assess data, helping to distinguish individual differences meaningfully. Together, these statistical and interpretative methods transform psychological assessments into powerful tools that guide decision-making, support targeted interventions, and promote a comprehensive understanding of cognitive, behavioral, and emotional development.
References
Anastasi, A. (1976). Psychological testing. N.D.: Pearson Education.
Gregory, R.J. (2005). Psychological testing: History, principles and applications. New Delhi: Pearson Education.
Hogan, T. P. (2013). Psychological Testing: A Practical Introduction (3rd ed.). New York: John Wiley.
Kaplan, R.M. & Saccuzzo, D.P. (2007). Psychological Testing: Principles, Applications, and Issues. Australia: Thomson Wadsworth.
Murphy, K. R., Davidshofer, R. K. (1988): Psychological testing: Principles and applications. New Jersey: Prentice Hall Inc.
Niwlikar, B. A. (2024, November 20). Norms in Psychological Testing: Transform Raw Data into Meaningful Insights. Careershodh. https://www.careershodh.com/norms-in-psychological-testing/
